Find Fluctuations
 Find Fluctuations tool compares short intervals of each strip against other overlapping strips. It computes elevation corrections for each strip based on a surface-to-surface comparison method. Each short time interval of a strip gets its own correction value. For the final correction file, the correction values can be averaged in order to get a smoother correction curve.
Find Fluctuations tool requires that laser points have time stamps and that the same pre-processing steps have been applied for the laser data as for the Find Match tool. You have to classify ground in each strip separately before this tool can be used. It does not require that trajectories are loaded. It uses trajectory information only to determine the relative accuracies of different strips.
The tool can run on loaded points in TerraScan or on a TerraScan project.
General procedure for finding and applying fluctuating corrections:
1. Select Find Fluctuations tool.
This opens the Find Fluctuations dialog:
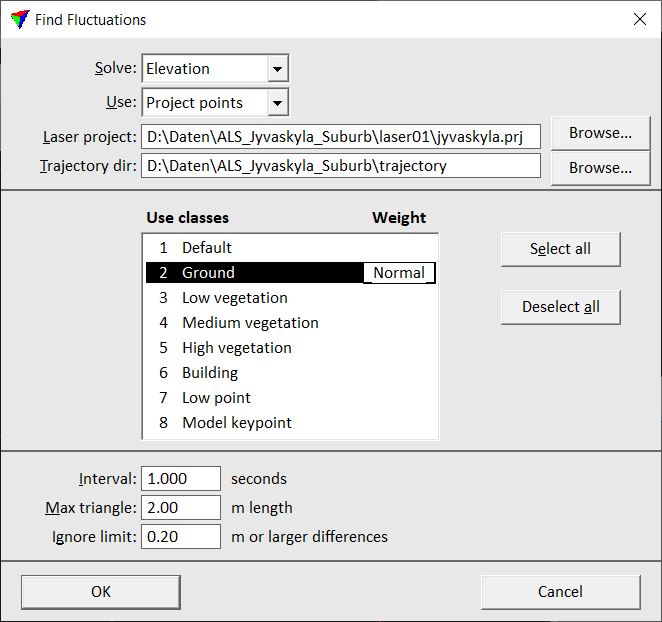
2. Select settings and click OK.
Setting |
Effect |
|---|---|
Solve |
Type of solution to find: Elevation. |
Use |
Points to use in find fluctuations: Loaded points or Project points (not UAV). |
Laser project |
TerraScan project file which defines the blocks to use in comparison. This is only active if Use is set to Project points. |
Trajectory dir |
Directory containing TerraScan trajectory files. |
Use classes |
Classes to use for comparison and weight factors to apply. |
Interval |
Time interval used by the software to calculate a correction value. |
Max triangle |
Maximum length of a triangle created for the surface-to-surface comparison. |
Ignore limit |
Limit value for differences between strips that the software tries to match. The values should be a bit higher than the largest mismatch between strips. Larger mismatches are treated as gross errors and therefore not included in the calculation. |
This opens the Fluctuations dialog:
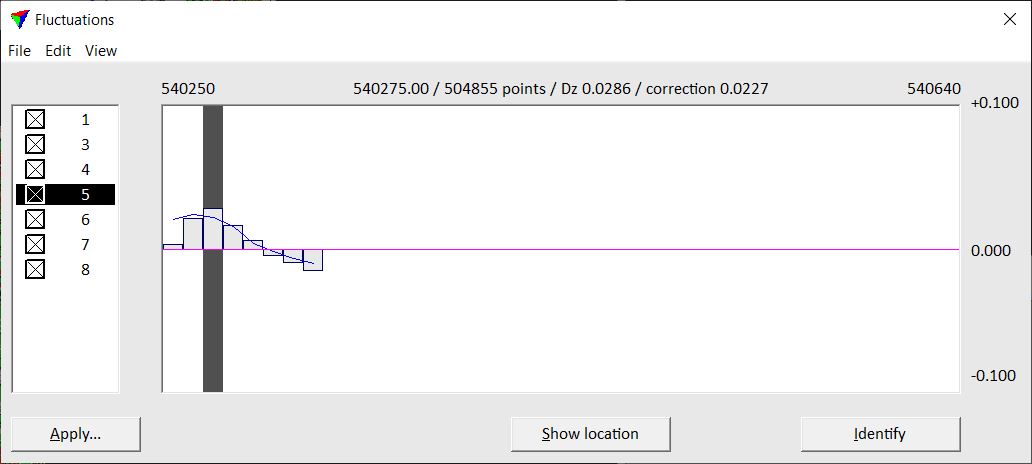
The dialog shows the list of strips on the left and a graph of corrections for the selected strip on the right. The yellow bars in the graph represent the time intervals for which a correction value is calculated. The correction value for a selected time interval is shown on top of the graph.
3. Check the fluctuating corrections using the buttons and menu commands from the Fluctuations dialog.
4. Save a corrections file using the Save results command from the File pulldown menu. The correction file allows to apply corrections later to the laser data with the Apply Correction tool.
OR
4. Apply corrections directly using the Apply button in the Fluctuations dialog.
This opens the Apply Fluctuation Corrections dialog:
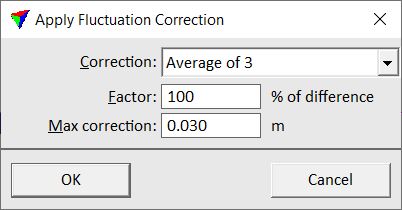
5. Define settings and click OK.
This applies the fluctuating corrections to the laser data.
Setting |
Effect |
|---|---|
Correction |
Method of averaging the correction values: •One step - no averaging applied. •Average of 3 - three observations are averaged. •Average of 5 - five observations are averaged. •Average of 7 - seven observations are averaged. •Average of line - the average value of a strip is used as a correction value. |
Factor |
Factor multiplied to the calculated correction values. A value of 50% means that the original correction values are multiplied by 0.5. |
Max correction |
Maximum allowed correction that is applied to the laser data. |
Fluctuations dialog for surface matching
The Fluctuations dialog provides several buttons and menu commands for visualizing, analyzing and saving the fluctuating correction values.
Show location button is used to highlight the location of a time interval in a CAD file view. Select the time interval in the Fluctuations dialog graph. Click the button and move the mouse pointer inside a CAD file view. The selected time interval is dynamically highlighted. Place a data click inside the view in order to center the view at the location of the time interval.
Identify button is used to select the location of a time interval in the Fluctuations dialog graph. Click on the button and place a data click in a CAD file view. This selects the time interval closest to the data click in the Fluctuations dialog graph.
Edit / Find big correction values
Find big correction values command selects locations with big correction values. It can find the largest value or values that are larger than a defined threshold.
To locate big correction values:
1. Select Find command from the Edit pulldown menu.
This opens the Find Fluctuation dialog:
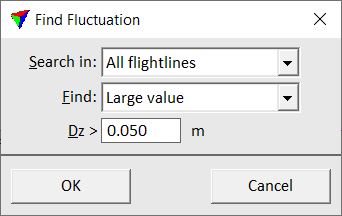
2. Select settings and click OK.
The time interval with the maximum correction value or the first value larger than the defined Dz threshold is shown in the Fluctuations dialog and selected in the graph.
Edit / Find next
Find next command can be used after the Find command has been used with Find set to Large value and a Dz threshold. The command selects the next time interval along the graph with a correction value larger than the defined threshold.
View / Display settings
Display settings command defines settings for the graph display in the Fluctuations dialog. This includes settings for the size of the yellow bars representing the time intervals and the maximum range of correction values. In addition, settings for displaying the correction curve and applying some averaging to the correction values are defined.
To define settings for the display of fluctuation corrections:
1. Select Display settings command from the View pulldown menu.
This opens the Display Settings dialog:
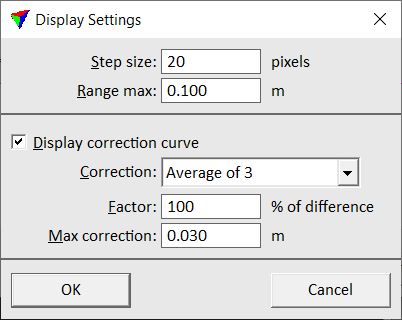
2. Define settings and click OK.
This applies the new settings to the graph display.
Setting |
Effect |
|---|---|
Step size |
Defines the display size of one time interval (width of the yellow bar) in the Fluctuations dialog graph. |
Range max |
Maximum correction value range displayed in the Fluctuations dialog graph. |
Display correction curve |
If on, the correction curve is displayed as blue line in the Fluctuations dialog graph. |
Correction |
Method of averaging the correction values: •One step - no averaging applied. •Average of 3 - three observations are averaged. •Average of 5 - five observations are averaged. •Average of 7 - seven observations are averaged. •Average of line - the average value of a strip is used as correction value. |
Factor |
Factor multiplied to the calculated correction values. A value of 50% means that the original correction values are multiplied by 0.5. |
Max correction |
Maximum allowed correction that is applied to the laser data. |
When a correction file is saved from the Fluctuations dialog, the settings for a correction curve and for averaging correction values are used as defined in the Display settings dialog.
View / Statistics
Statistics command shows a dialog with some statistical values for the fluctuations per strip and for all strips. The statistics includes minimum, maximum, and average correction value, median, average magnitude and standard deviation.
You can save a text file or print the statistics using commands from the File pulldown menu in the Statistics dialog. The dialog size can be changed with commands from the View pulldown menu.