Find Tie Line Fluctuations
 Find Tie Line Fluctuations tool compares short intervals of each strip against other overlapping strips. It computes corrections for different parameters based on tie lines. Each short distance interval of each strip gets its own correction value. For the final correction file, the correction curve can be smoothed.
Find Tie Line Fluctuations tool requires tie lines that are suitable for calculating fluctuating correction values for the different parameters. The tie lines are collected using commands from the TerraMatch Tie line window. Additionally, tie points collected in TerraPhoto based on images can be included in the calculation. The tie points in TerraPhoto must be of types Known depth or Depth tie points.
The smoothing of the correction curve can be done using two alternative methods:
•Restricted curve: The smoothing of the correction curve involves the accuracy estimates for trajectory positions. Bigger corrections values are applied for positions where the accuracy estimate is worse. If trajectories are estimated to be very accurate, no rapid drift is modeled even though tie line observations may indicate that. The Max rate factor determines, how fast the corrections curve changes can be. A small factor results in a smoother curve. This should be used if the tie lines are not so good and may contain outliers. A bigger factor results in a less smooth curve and the single tie line observations get more influence in the final solution. This should be used for good tie lines.
•Smooth curve: A 1D Gaussian filter is implemented to handle filtering of any kind of observations. It should reduce the impact of noise but still model the drift if there are good observations. It was developed based on MMS data with drift in XY and Z. The smoothing may allow rapid changes in the correction curve if the tie line observations are accordingly. The method is suited for data sets where there are many stops or slow-downs during the drive along the same trajectory, and when travel distance is not changing so much (up to 4 * sigma). The averaging is performed along the neighborhood of one trajectory, where each tie line observation gets in the end one time stamp.
If accuracy estimates for trajectory positions are not available, the software uses values defined in Default trajectory accuracy category of TerraMatch Settings.
General procedure for finding and applying fluctuating corrections:
1. Select Find Tie Lines Fluctuations tool.
This opens the Find Tie Line Fluctuations dialog:
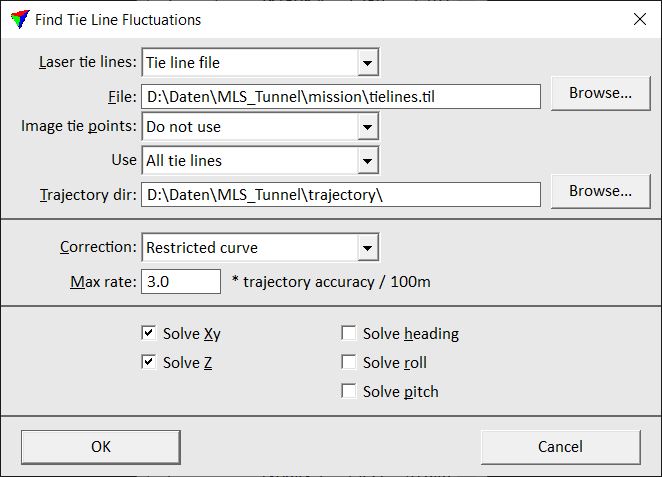
2. Define settings and click OK.
Setting |
Effect |
|---|---|
Source |
Source file for calculating the fluctuating corrections: •Active tie lines - tie lines in an open Tie line window are used. •Tie line file - tie lines stored in a tie line file are used. |
Tie lines |
Path to the tie line file that is used for calculating the corrections. This is only active when Source is set to Tie line file. |
Image tie points |
Determines whether tie points from TerraPhoto are included in the calculation: •Do not use - no tie points from TerraPhoto are used. •Active tie points - known depth tie points are used if a tie point file is loaded in TerraPhoto. |
Use |
Defines what tie lines to use for calculating the corrections: •All tie lines - use all tie lines. •Known points only - use only tie lines of type Known xyz, Known xy, Known z and Known line. |
Trajectory dir |
Directory where the TerraScan trajectory files are stored. |
Correction |
Determines the method for smoothing the correction curve: •Free curve - no smoothing is applied. Each tie line observation fully effects the solution. •Restricted curve - smoothing based on trajectory accuracy estimates is applied. The amount of smoothing is determined by the Max rate factor and effected by the accuracy of trajectory positions. •Smooth curve - smoothing based on a 1D Gaussian filter is applied. |
Max rate |
Determines how fast the corrections curve changes can be. A smaller factor results in a smoother curve. Values can range between 0.1 and 100.0, the default value is 2.0. This is only available if Correction is set to Restricted curve. |
Range |
Distance forward and backward from a tie line observation within which correction values are averaged. Values can range between 0.1 and 100.0, the default value is 50. This is only active if Correction is set to Smooth curve. |
Solve Xy |
Solves for a fluctuating xy correction. |
Solve Z |
Solves for a fluctuating z correction. |
Solve heading |
Solves for a fluctuating heading correction. |
Solve roll |
Solves for a fluctuating roll correction. |
Solve pitch |
Solves for a fluctuating pitch correction. |
This opens the Fluctuations dialog:
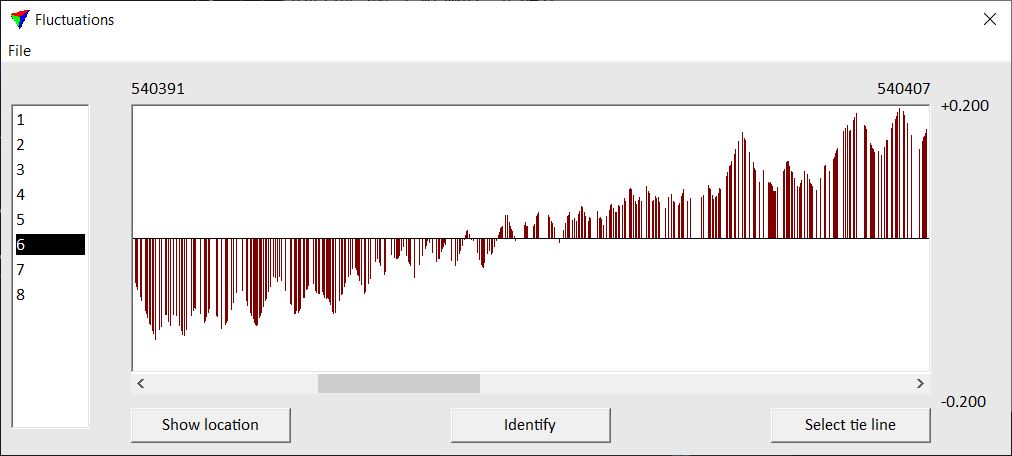
The dialog shows the list of strips on the left and a graph of corrections for the selected strip on the right. The red bars in the graph represent the tie line observations from which a correction value is calculated. The correction value for a selected observation is shown on top of the graph.
3. Check the fluctuating corrections using the buttons and commands from the Fluctuations dialog. The options are described in Section Fluctuations dialog for tie lines.
4. Save a corrections file using the Save corrections command from the File pulldown menu.
5. Apply the corrections to the laser data, tie lines, and other data types using the Apply Correction tool.
Fluctuations dialog for tie lines
The Fluctuations dialog provides several buttons and menu commands for visualizing, analyzing and saving the fluctuating correction values.
Show location button is used to highlight the location of a time interval in a CAD file view. Select the time interval in the Fluctuations dialog graph. Click the button and move the mouse pointer inside a CAD file view. The selected time interval is dynamically highlighted. Place a data click inside the view in order to center the view at the location of the time interval.
Identify button is used to select the location of a time interval in the Fluctuations dialog graph. Click on the button and place a data click in a CAD file view. This selects the time interval closest to the data click in the Fluctuations dialog graph.
Select tie line button is used to select a tie line observation in the Tie lines window. Select a tie line observation in the Fluctuations dialog graph and click the button. This selects the tie line observation in the Tie line window.
File / Display settings
Display settings command defines settings for the graph display in the Fluctuations dialog. This includes settings for displaying correction vectors in CAD file views and for the content shown in the graph display.
To define settings for the display of fluctuation corrections:
1. Select Display settings command from the File pulldown menu.
This opens the Fluctuations display settings dialog:
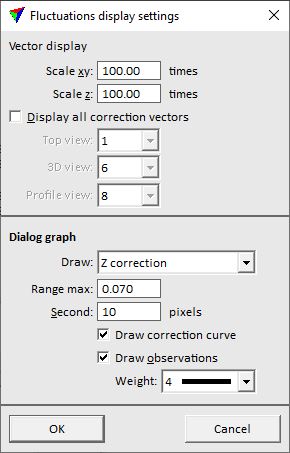
2. Define settings and click OK.
This applies the new settings to the graph display and the vectors shown in CAD file views.
Setting |
Effect |
|---|---|
Scale xy |
Scale factor for the display of correction vectors in xy direction. |
Scale z |
Scale factor for the display of correction vectors in z direction. |
Display all correction vectors |
If on, correction vectors are displayed as lines in CAD file views. The length of the line is the correction value at this location scaled by the value set for Scale xy and Scale z. |
Level |
Level number in the CAD file on which the correction vectors are displayed. |
Top view |
Number of the CAD file view for displaying the correction vectors in a top view. |
3D view |
Number of the CAD file view for displaying the correction vectors in a 3D view. |
Profile view |
Number of the CAD file view for displaying the correction vectors in a profile view. |
Draw |
Correction that is displayed in the Fluctuations dialog graph. |
Range max |
Maximum correction value range displayed in the Fluctuations dialog graph. |
Second |
Defines the display size of one second time interval in the Fluctuations dialog graph. |
Draw correction curve |
If on, a line element represents the correction curve in the graph display in addition to the correction vectors. |
Draw observations |
If on, the tie line observations are shown in the graph display as red dots in addition to the correction vectors. The size of the dots is determined by the Weight selection. |